Creating a Mandelbrot Set in Excel
One day I was reading about a book that Benoit Mandelbrot wrote, The (Mis)Behavior of Markets: A Fractal View of Risk, Ruin, and Reward. This reminded me of the Mandelbrot Set, which I had briefly learned about in high school and college. I recalled an assignment I had in an introductory Java class in which we had to graph the Mandelbrot Set. So I decided I should try it in Excel.

Using an Excel Chart to Plotting the Mandelbrot Set
The first way I decided to graph the Mandelbrot Set was by generating random coordinates and plotting them on an Excel graph. This probably isn't the best way to graph the Mandelbrot Set in Excel -- it has a few limitations:
Despite these limitations, I didn't know much about the Mandelbrot Set, so I figured this would be an easy way to learn about it. The method I used is fairly simple (provided you know a little Excel VBA) and it helped me learn as I created the sheet.
The Mandelbrot Set is a fractal. Benoit Mandelbrot coined the term "fractal" which he defined as "a rough or fragmented geometric shape that can be split into parts, each of which is (at least approximately) a reduced-size copy of the whole."
The Mandelbrot set uses the complex plane -- in which the real number line is on the x-axis and the imaginary number line is on the y-axis. The base imaginary number is i, which is the square root of -1. Complex numbers are a combination of real and imaginary numbers. For example, a simple complex number is 1+i. Fortunately, Excel has built-in functions that allow us to use complex numbers. I used the following functions in the Mandelbrot Set file:
- COMPLEX - used to turn the real and imaginary coefficients into a complex number
- IMSUM - returns the sum of two complex numbers
- IMPRODUCT - returns the product of two complex numbers
- IMAGINARY - returns the imaginary coefficient of a complex number
- IMREAL - returns the real coefficient within a complex number
The Mandelbrot set uses the formula zn+1 = zn2 + c, where c is a complex number. The absolute value of zn will not exceed a certain number depending on the value of c, except for cases in which z goes to infinity. The Mandelbrot Set includes all values of c which do not cause z to go to infinity. It so happens that this is all values of c where the magnitude of c is less than 2. The magnitude is found by taking the real and imaginary coefficients in c, squaring them, adding them, and then taking the square root. Basically, it's the length of the vector created on the complex plane eminating from the origin. Or the length of the hypotenuse of the triangle created by the coefficients (use the Pythagorean Theorem to solve for it).
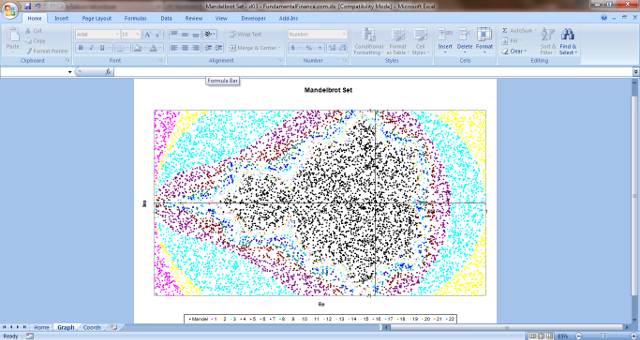
The Excel file I created uses a macro to plug in random values for the real and imaginary coefficients of c. It then determines what the magnitude of c is after 30 iterations of the equation above. If the magnitude is less than 2, then the macro puts the coefficients of c into a series used to plot the Mandelbrot Set in Excel. If it's greater than 2, then depending on how many iterations it took to get above 2, the macro plugs the coefficients into one of 22 other series plotted on the same Excel scatter chart. Each series has a different color, which gives the chart an interesting look.
Download the Excel Mandelbrot Set here. (I left some data in it, so it's 14MB. Sorry.)
XY Scatter Chart of the Mandelbrot Set

Graph the Mandelbrot Set on a Sheet
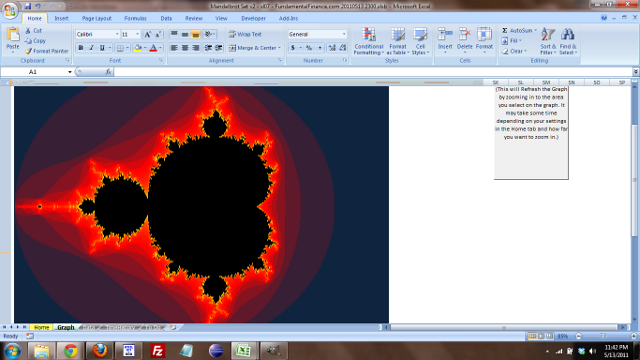
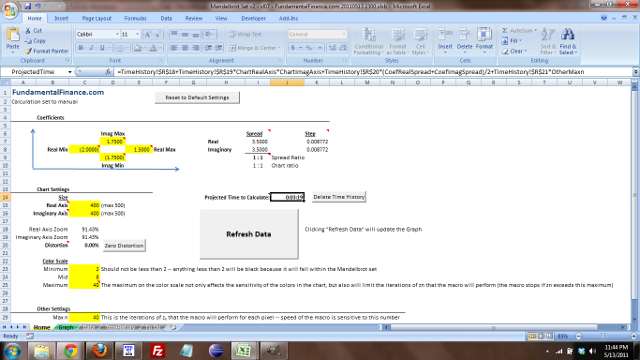
Graphing on an XY Scatter plot was pretty ugly. So I found a better way which you can see below. It is much more involved, and includes a tab to adjust the settings and it is zoomable. I have more features in mind, but no time to add them right now. Here is the file that you can peruse:
Download the Excel Mandelbrot Set v2 here. (It's just under 1MB and requires Excel 2007.)
Mandelbrot Set Graph

Settings Tab

Enjoy!
|